

Long Term Trend – Declining Nonpublic School Enrollment.
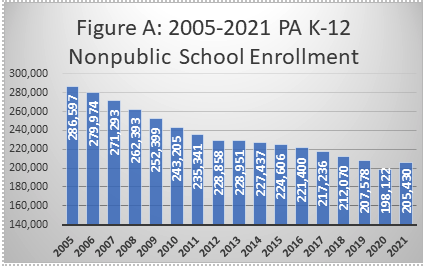 According to PA Department of Education data, enrollment in PA nonpublic schools declined from 286,597 K-12 students in 2005 to 198,122 in 2020.
During this period, enrollment declined almost every year (except 2013) by an average of -5,900 students.
2021 is the first year on record that nonpublic school enrollment increased, to 205,430 students in October 2021.
Analysis.
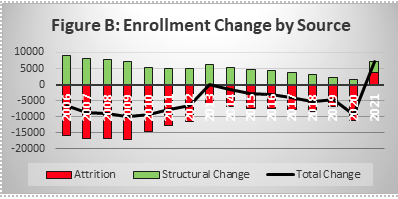 Throughout the period of decline from 2005 to 2020, average attrition from the nonpublic school system was -4.3%. This means that every year, on average, 4.3 of every 100 K-11 nonpublic school students left to public school, homeschool, or a school in another state. Attrition was worse in the grades when students generally transition from one school to another – 1st grade and 9th grade.
Negative attrition was compounded by declining Kindergarten class sizes. Not only were kids leaving the system every year, but also fewer kids chose to enter the feeder grades in nonpublic schools every year.
Cost to State.
Given that the Pennsylvania child population declined by 140,000 from 2008 to 2019 whereas PA public school enrollment declined by merely 13,602 students during this same period, it seems that the 88,475 students who left nonpublic school ended up in public schools.
The decline of nonpublic schools has imposed a significant cost to state and local governments. According to the federal Annual Survey of School System Finances, in 2019-20 Pennsylvania school districts spent $13,915/pupil on student instruction and pupil support – the variable costs you would expect to rise or fall directly with enrollment. Thus, shifting 88,475 students from nonpublic to public schools cost state and local governments at least $1.2 billion in FY19-20 – to speak nothing of the administrative, building, and capital costs.
Notably, attrition in nonpublic schools moderated significantly over the past 16 years. Whereas attrition was -5.5% until 2012, it went down to -3.3% since then. This may be the result of the growth in the PA Educational Improvement Tax Credit scholarship (from $34.3M in 2005 to $258M in 2022) and the Opportunity Scholarship Tax Credit and Econ. Disadvantaged Schools (from $0 in 2005 to $60M in 2022) programs, which help nonpublic school parents keep their children enrolled in nonpublic school.
Jewish Day Schools – Overall Enrollment Trends.
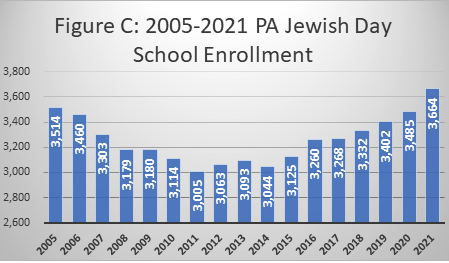 Enrollment in PA Jewish schools declined from 3,514 students in 2005 to 3,005 in 2011.
This 14% decline in enrollment coincided with a closure of 9 of the 36 Jewish day schools that were operating in 2005.
Since 2011, enrollment has recovered to an all-time-high of 3,664 students enrolled in 30 Jewish schools statewide.
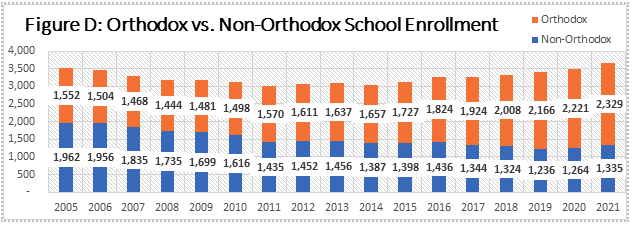
Diverging Trends – Orthodox vs. Non-Orthodox Schools.
While these overall numbers tell a story of decline and recovery, digging deeper we see a more consistent trend during these years of decline in non-Orthodox schools and growth in Orthodox schools.
Impact of COVID-19.
Nonpublic schools across the board saw a large uptick in enrollment in October 2021, over a year into the COVID-19 pandemic. This was the second year on record where Kindergarten enrollment increased compared to the prior year. It was the only year when we saw overall positive attrition – students actually entering the nonpublic schools system mid-career.
This reversal of fortunes was true in Non-Orthodox schools as well, which saw large increases in Kindergarten enrollment and reductions in the attrition problems (non-Orthodox day schools saw positive attrition in all grades 2-5 in 2021).
We look forward to the 2022-2023 enrollment data to assess the “stickiness” of this reversal of fortunes.